Foundry theme
Resource

The ROI of AI automation.
A case you can defend.

Most AI ROI claims are a percentage with no method behind it. This page gives you the structure instead, and then works one case all the way through with its assumptions on the table — so you can swap in your own numbers and see what actually moves the answer.

THE FRAMEWORK
01

Start from a unit of value

Not tokens, not hours saved in the abstract. Cost per resolved ticket, per document processed, per qualified meeting, per record emitted. A unit of business meaning can be compared against the process it replaces and survives a change of model or vendor.
02

Measure the baseline first

What does that unit cost today, fully loaded — people, tooling, management, rework? If nobody can answer, the project has no baseline to beat, and any return claimed later is unfalsifiable. This step is usually the one that gets skipped.
03

Model the full cost

Inference is the visible line. The omitted ones — retries, evaluation traffic, conversational growth, reindexing, migration on deprecation, and the people who maintain the system — are set out on the cost model page. A business case that leaves them out is wrong in a predictable direction.
04

State the sensitivities

Which assumption, if wrong, changes the answer? Usually volume, or the share of cases that need an expensive model or a human. Put those in explicitly, with a range, so a finance function can interrogate the case rather than accept or reject a single number.
05

Model three volumes

The pilot, the realistic first year, and the scenario where it works better than expected. The third matters most: systems that deliver get used more, and a case that only holds at pilot volume is a problem waiting for success to trigger it.
06

Put the measurement in before the claim

Decide what will be measured, at what boundary, by whom, before the system ships. A support agent’s deflection counted at a 7-day reopen window is a different number from the one counted on day one. Payback is then a date with its assumptions next to it, not a promise.
THREE WORKED SHAPES

The framework is the same everywhere; what changes is the unit and the sensitivity. Three common shapes, with the figures left for you to fill in.

Outbound research and outreach. The unit is a qualified meeting. The baseline is the fully loaded cost of the people and tooling that produce one today. An autonomous SDR design changes the scaling constraint: it can research target accounts from public filings and permitted data sources and draft outreach for a person to release, subject to your lawful basis for contacting those prospects under GDPR and ePrivacy rules. The sensitivity is reply quality — a cheaper meeting that does not convert is not cheaper.

Customer support. The unit is a resolved ticket. The baseline is volume × handle time × loaded hourly rate, plus the tooling. A retrieval agent can deflect a meaningful share of first-line tickets — measured at a reopen window, not promised up front; the support-deflection reference architecture sets out why deflection rate alone is the wrong headline. The return is a reduction in the headcount needed as volume grows, plus a potential improvement in satisfaction from faster, round-the-clock first response in the languages you have evaluated the agent in.

Engineering on legacy systems. The unit is harder to name — time to answer a question about an undocumented codebase is the honest one. Semantic search and explanation over a legacy system can reduce the time senior engineers spend deciphering it. This can yield significant long-term return, and it is the hardest of the three to measure, so the baseline has to be taken deliberately before the tooling arrives.

A WORKED EXAMPLE

Frameworks are easy to agree with and hard to use, so here is one worked all the way through: first-line support deflection at a mid-sized SaaS company. Every number below is an assumption, not a measurement. They are the assumptions we would start a scoping call from; yours will differ, and the point of writing them down is that you can argue with each one.

Value Where it comes from
Support tickets per month 4,000 Your helpdesk export
Share that is repetitive first-line 60% → 2,400 Tag audit of a normal month
Average handle time 7 minutes Helpdesk median, not mean
Loaded cost of an agent-hour €28 Salary + employer cost + tooling + management
Deflection at a 7-day reopen window 45% of the first-line segment A design target to validate in the pilot
Model and infrastructure per ticket attempted €0.05 Tokenised against real tickets, not estimated
Quality sampling 5% of deflections re-read, 3 min each The control that keeps the number honest
Maintenance 1 engineer-day per month, €480 Content drift, evals, model changes
Build cost €45,000 Mid production-build band on our pricing page

Illustrative assumptions for a worked example. These are not measured client outcomes.

The arithmetic

What the segment costs today. 2,400 tickets × 7 minutes = 280 agent-hours a month. At €28 loaded, that is €7,840 a month. This is the only number in the model that is worth measuring properly before anything is built, because everything else is compared against it.

What the system removes. Deflecting 45% of that segment is 1,080 tickets, or 126 agent-hours — €3,528 a month of gross saving. Note what this is not: it is not 45% of your support cost. It is 45% of 60% of it, which is the kind of distinction that decides whether a business case survives its first finance review.

What the system costs to run. The model attempts all 2,400 first-line tickets, not just the ones it deflects, so inference is 2,400 × €0.05 = €120. Sampling 5% of 1,080 deflections at 3 minutes is 2.7 hours, or €76. Maintenance is €480. Total ≈ €676 a month.

Net and payback. €3,528 − €676 = €2,852 a month. Against a €45,000 build, payback lands around month 16.

What actually moves the answer

Sixteen months is a real answer, and for a lot of companies it is the wrong side of the line. That is the useful part of doing the arithmetic rather than quoting a percentage: it shows you which assumption you are really betting on.

Volume dominates everything else. The build cost barely moves with ticket volume; the saving moves with it almost linearly. Run the same model at 12,000 tickets a month and the gross saving becomes €10,584, the running cost rises only to about €1,067, and payback falls to roughly month 5. Same system, same deflection rate, entirely different decision.

Deflection rate matters less than people expect. Moving deflection from 45% to 60% at 4,000 tickets pulls payback in from about month 16 to about month 11. Tripling the volume pulls it in to month 5. Teams spend their energy on the wrong variable here, and vendors encourage it, because deflection rate is the number that appears on the slide.

Handle time is where the estimate usually breaks. The tickets an AI deflects most easily are the short ones. If your 7-minute average is dragged up by complex cases the system will not touch, the saving is on a shorter ticket than the average implies — which is why the assumption above says median, not mean, and why we sample the deflected set rather than trusting the aggregate.

If the honest version of this model does not clear your threshold, that is the answer, and it is cheaper to find here than in month nine of a build. We would rather show you this arithmetic on a call than a case study.
THE POSITION
A return you cannot measure is a return you cannot claim. Build the instrument first; the business case is what it reads.
QUESTIONS
QUESTIONS — 3

It depends on volume and on the cost of the process being replaced, which is why we model it before quoting it — with the assumptions written next to the date. Anyone who gives you a payback period before seeing your volumes is guessing.

Unrouted model usage: a frontier-model call hardcoded for a task a small model handles. Routing the routine traffic elsewhere can cut the cost of the affected traffic substantially, and the people who maintain prompts and watch quality are the largest line most cases omit.

Then measure it for a fortnight before the project starts. A sampled, dated baseline is worth more than any projection, and it is the only thing that lets you show a return afterwards rather than assert one.

Keep reading
30-minute technical call · no deck

Bring your
volumes.

Thirty minutes with your ticket counts, document volumes or pipeline numbers is enough to say whether a case is there — and to say so if it is not.

CASE STUDIES

Shipped work.
Go and check it.

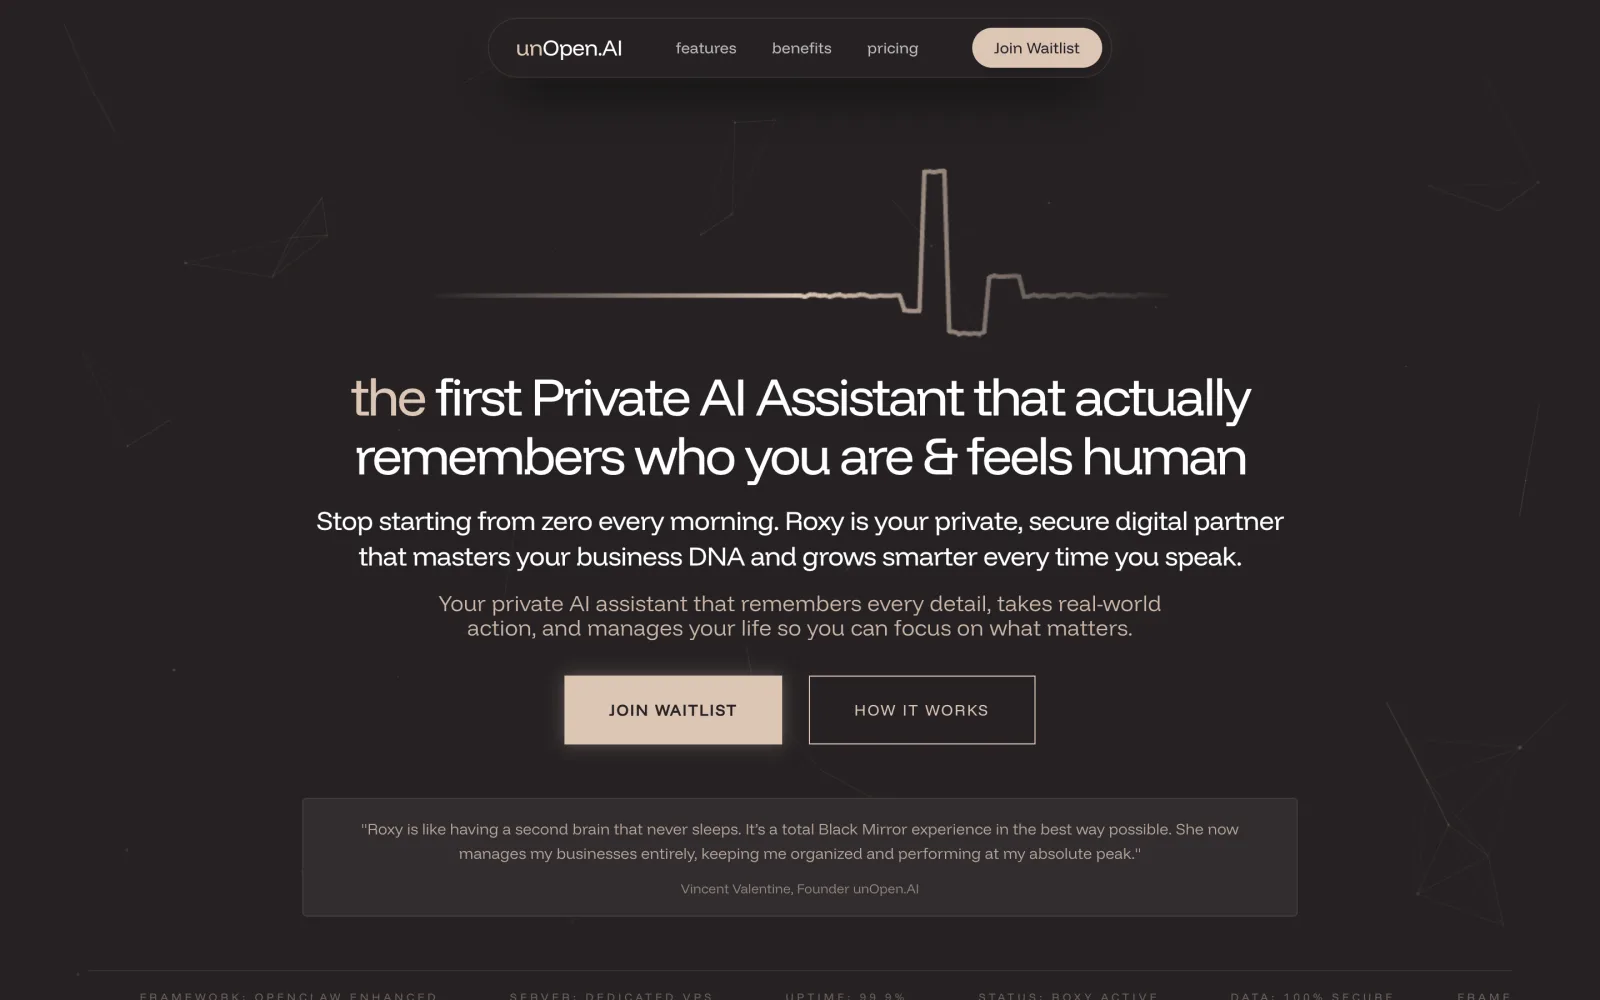
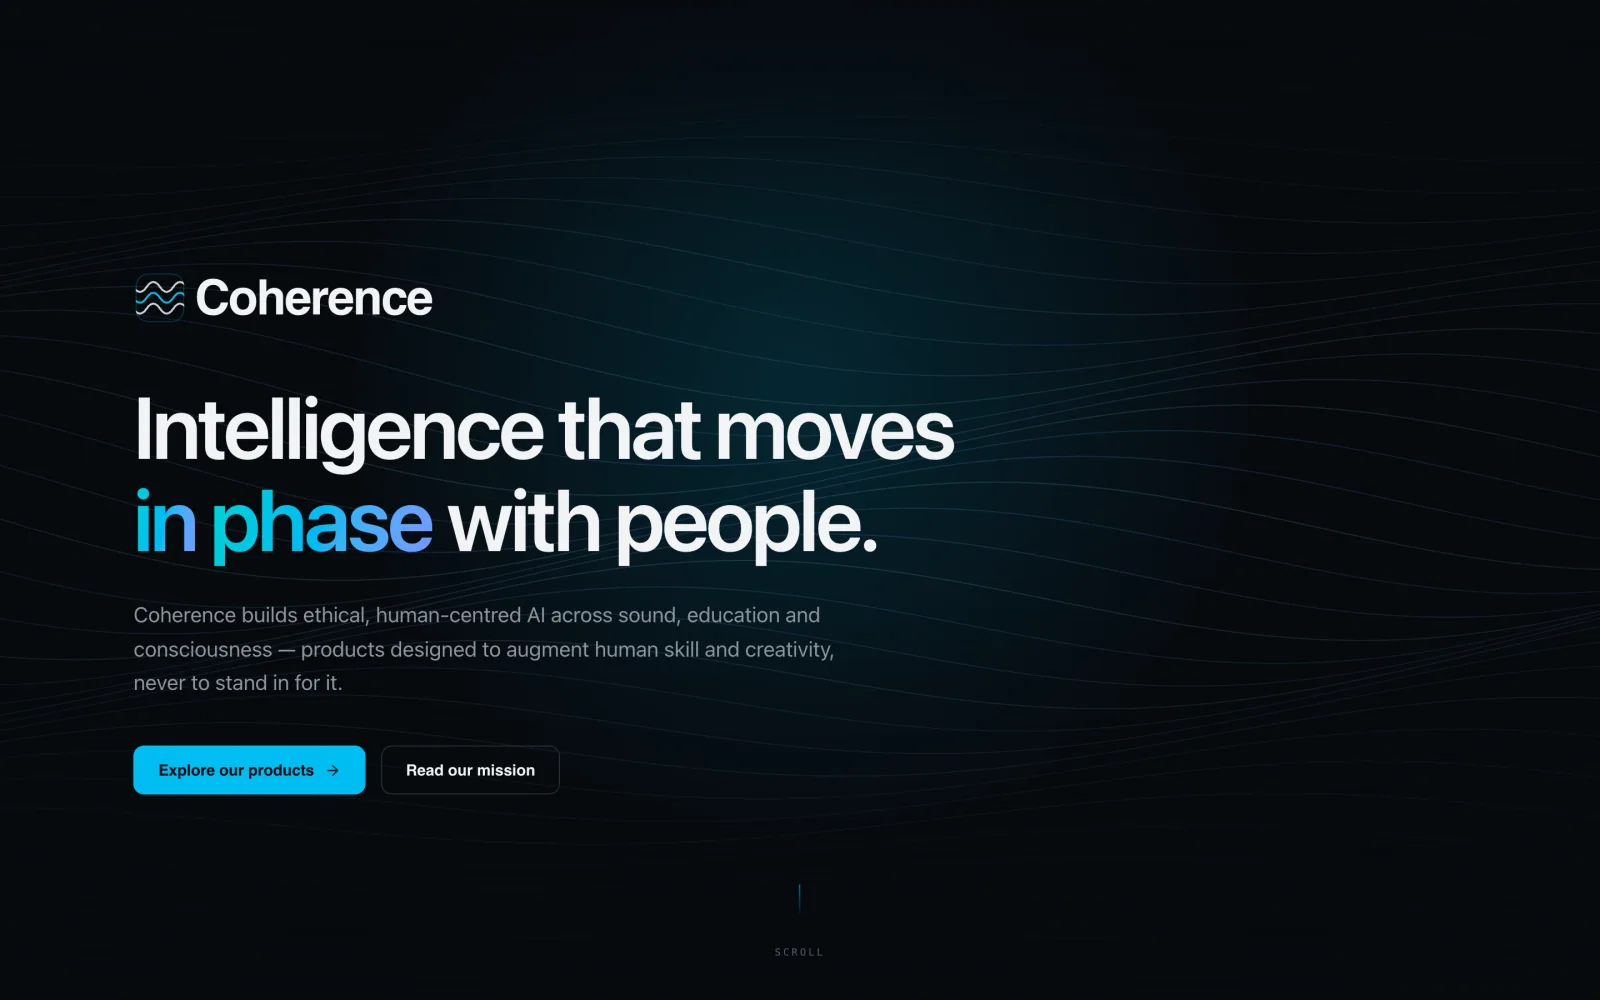
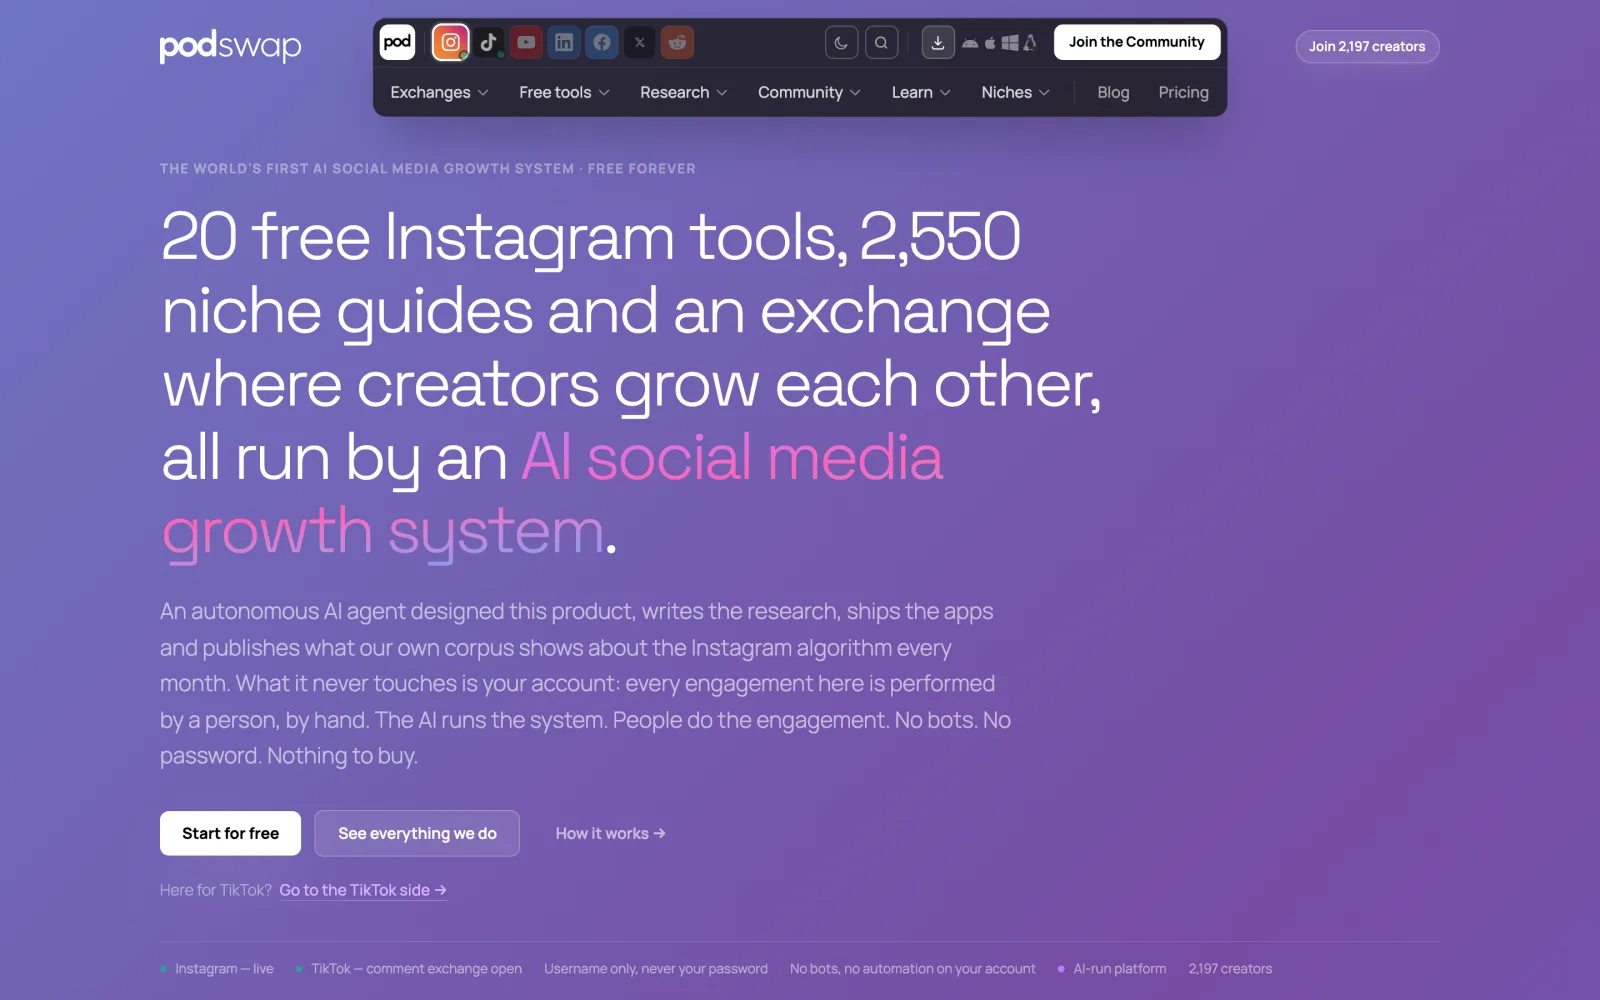
The work we can name, with the live site, our scope and the boundary made explicit. Select a project to see the evidence; each is a full case study, not a logo or a claim.

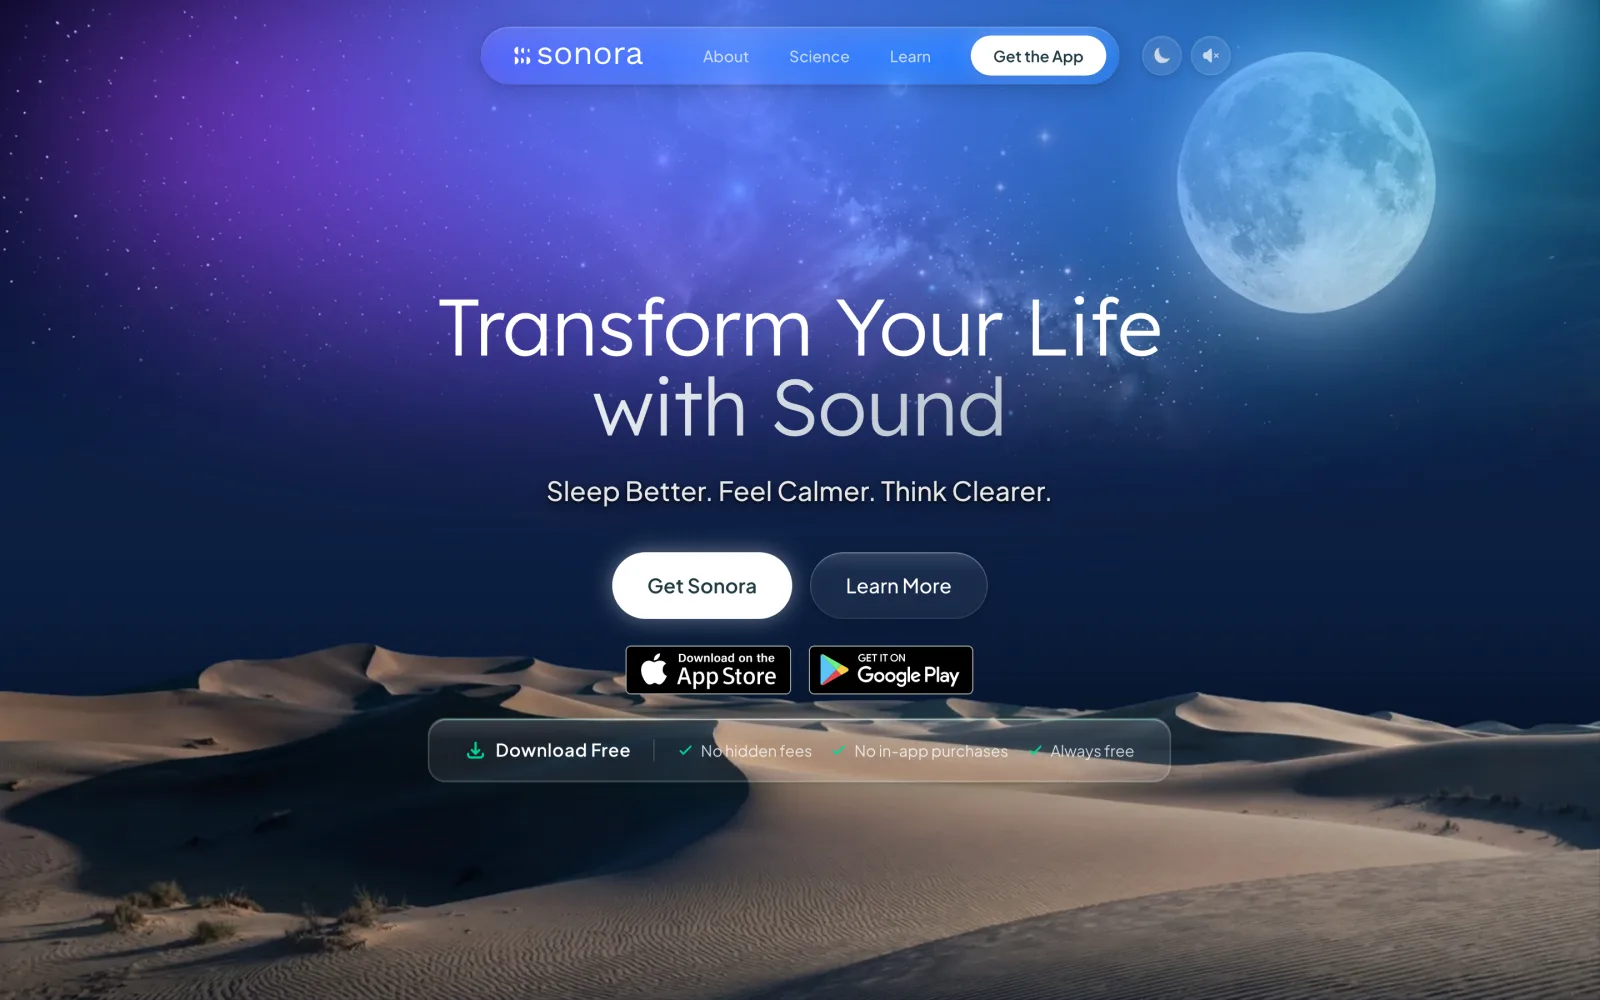
sonora.com
The Sonora homepage on desktop: a full-bleed dune landscape behind the headline “Transform Your Life with Sound”, with App Store and Google Play download buttons.
sonora.com — homepage, 1440×900 sonora.com →
Live Consumer wellness · Mobile + web

Sonora

Cognitive AI Ltd · 2026

A free sound-wellness app, described by its publisher as AI sound therapy that reads a short vocal sample at the start of a session and generates a soundscape for that moment. We designed and built the website and its backend, produced assets for the iOS and Android apps, and supported the application prototype.

Read the case study →

See every published project →

WHO WE HAVE BUILT FOR

Twenty-one years of applications, platforms and campaigns for names you know.

See all of our work →